Personal project · 2026
F1 Analysis Platform
An end-to-end analytics stack on every Formula 1 session since 2023. I built the ingestion, the data model, the analysis and the dashboard, using the same patterns I use at work, applied to a sport I love.
Why I built it
At work I build BI on Microsoft's stack. I wanted a project that showed the same skills end to end, in the open, using the analytics-engineering tools that are becoming standard: dbt for modelling and testing, DuckDB as the warehouse, and BI-as-code for the dashboard. Formula 1 is a great dataset for it. It's messy, it's high-volume, and every number can be checked against reality.
Architecture
- OpenF1 API16 endpoints, rate-limited
- Python extractorIncremental, idempotent
- BronzeRaw JSON in DuckDB
- Silver → Golddbt: typed staging, star schema, 91 tests
- DashboardStatic site, queries run in the browser
1 · Extraction
A small Python package pulls the OpenF1 API into a bronze schema in DuckDB. Each record is stored as raw JSON,
so when a season adds or drops fields the load never breaks; types are applied later, in dbt.
- Incremental and idempotent. Data loads per race weekend inside a transaction, and an ingestion log records every outcome. Re-running never duplicates data, and failed loads are retried automatically next run.
- Rate limits respected. The original notebook version silently lost data when the API throttled it. The rebuilt client paces itself under the limit and retries throttled requests instead of recording them as "no data".
- 5× fewer API calls by loading a whole weekend per request instead of one session at a time.
2 · Modelling
dbt turns bronze into a silver layer (one typed, deduplicated model per endpoint) and a gold star schema: dimensions for meetings, sessions, drivers and teams; facts for laps, stints, pit stops, results and standings; and aggregate models for the analysis. Two modelling problems were more interesting than they look:
- Driver identity. Car numbers aren't stable (Lando Norris raced as #4, then #1), so a session-level bridge table resolves each number to a permanent driver key.
- Team identity. Teams rebrand (AlphaTauri → RB → Racing Bulls), so a small seed table links names into one lineage for multi-season views.
Here's the core of the gold layer: one row per lap in the fact table, joined to conformed dimensions for the session, driver and team. Sessions roll up to race weekends (a small snowflake), so any lap can be sliced by season, circuit or weather.
Swipe sideways to see the full schema →
Beyond 91 automated tests, I validated gold against the real world: final drivers' and constructors' standings match the official results for 2023–2025.
3 · Analysis
The fun part. A few of the methods behind the dashboard:
- Fuel correction. Cars get about 0.03 s faster per lap as fuel burns off, which hides tyre wear. Raw degradation came out near zero for every compound; after correcting each lap to an end-of-race fuel load, the real ranking appears: Soft 0.046, Medium 0.033, Hard 0.027 seconds lost per lap.
- Clean laps. Pace comparisons only use representative laps: no lap 1, no pit in/out laps, nothing slower than 107% of the session median (which drops safety-car laps).
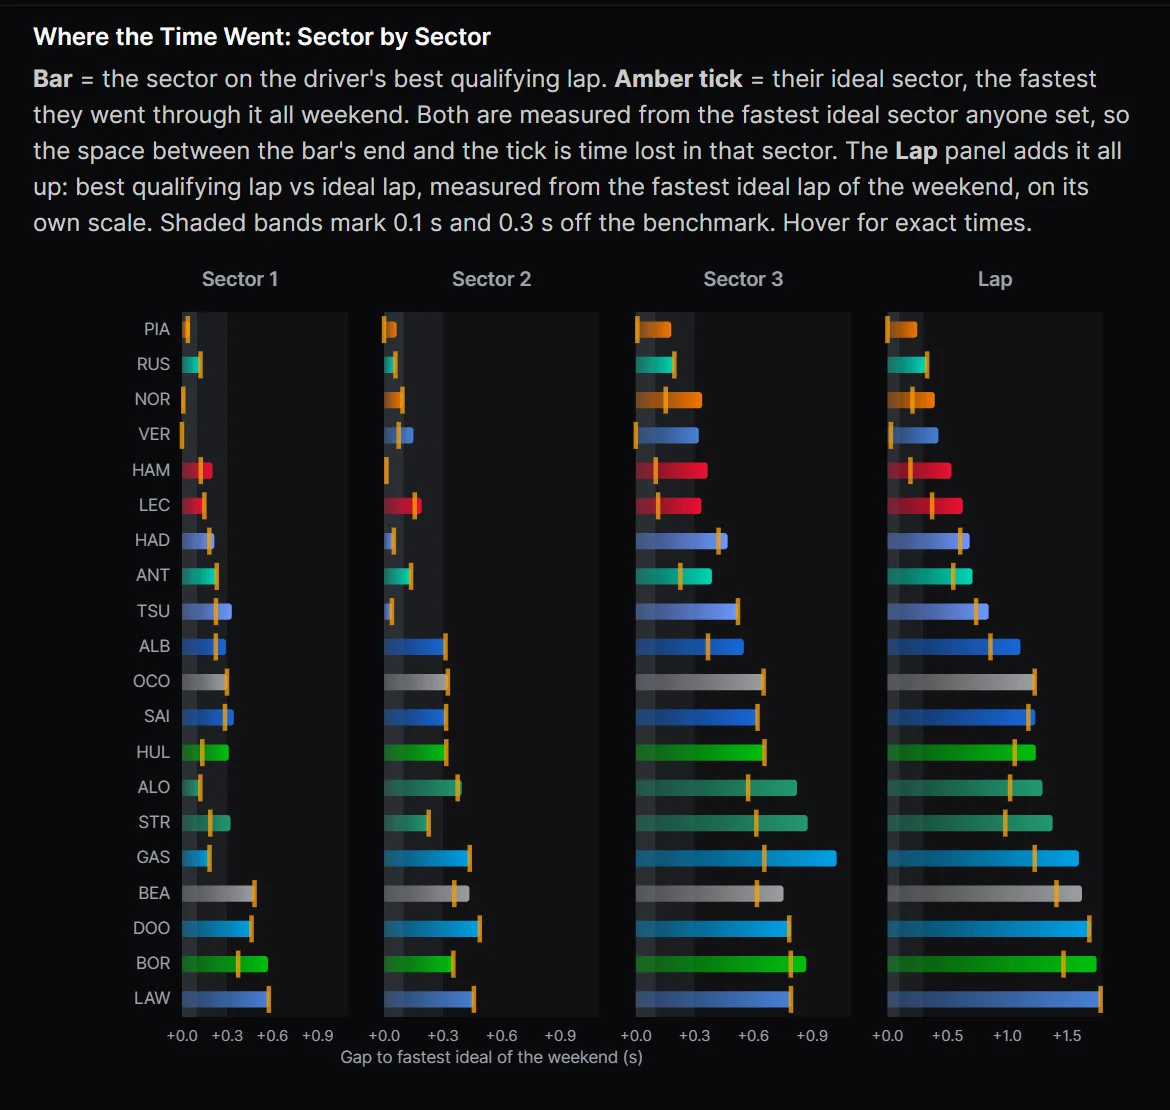
- The ideal lap. Each driver's best sector 1, 2 and 3 from any session of the weekend, compared with their best qualifying lap. Wet qualifying sessions are detected and excluded automatically, so dry practice sectors aren't compared against a wet lap.
4 · Dashboard
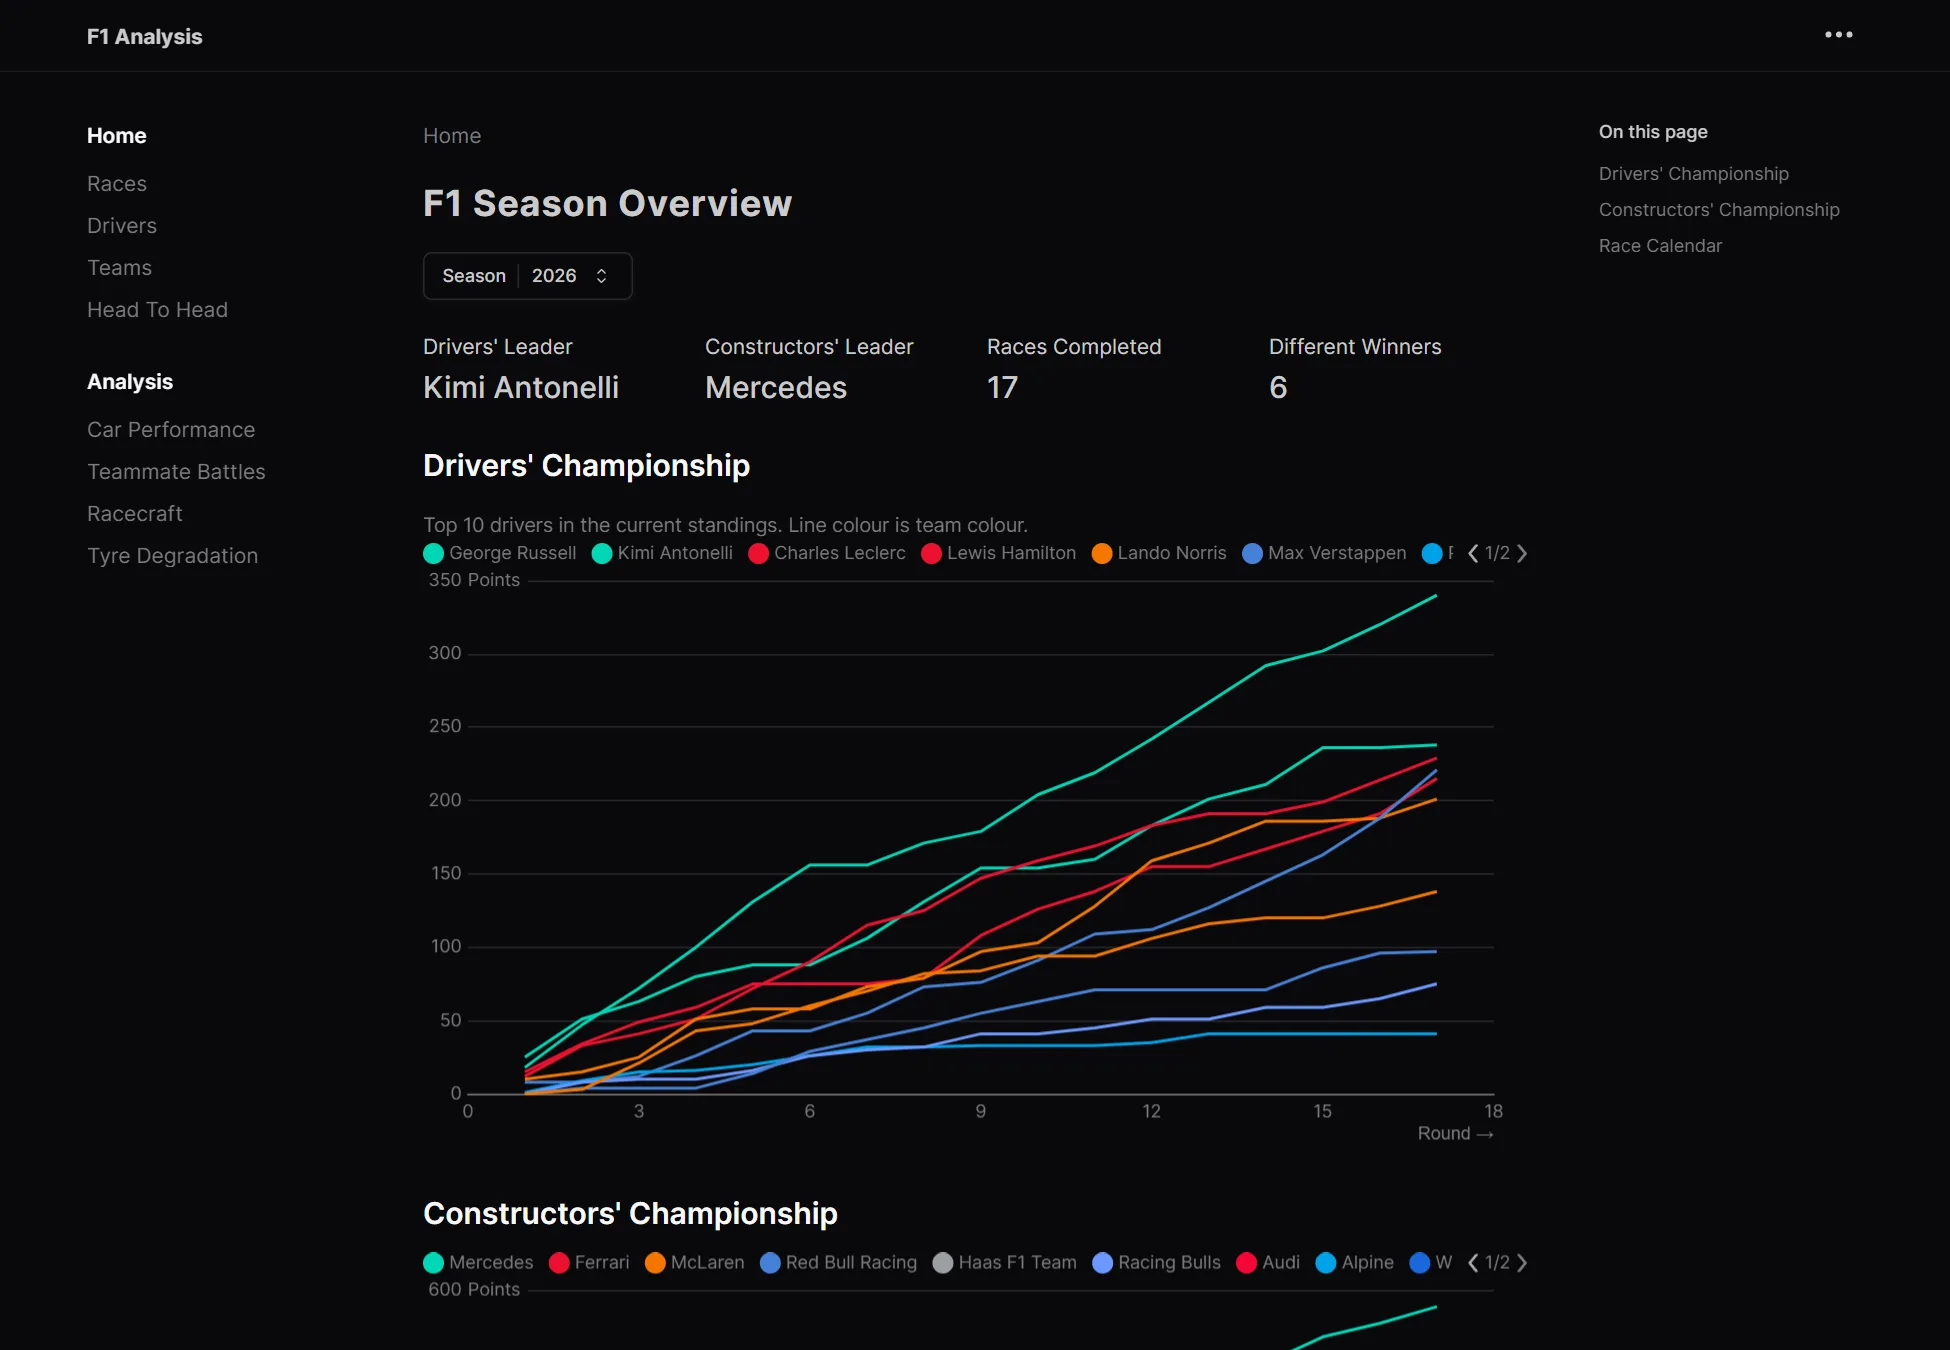
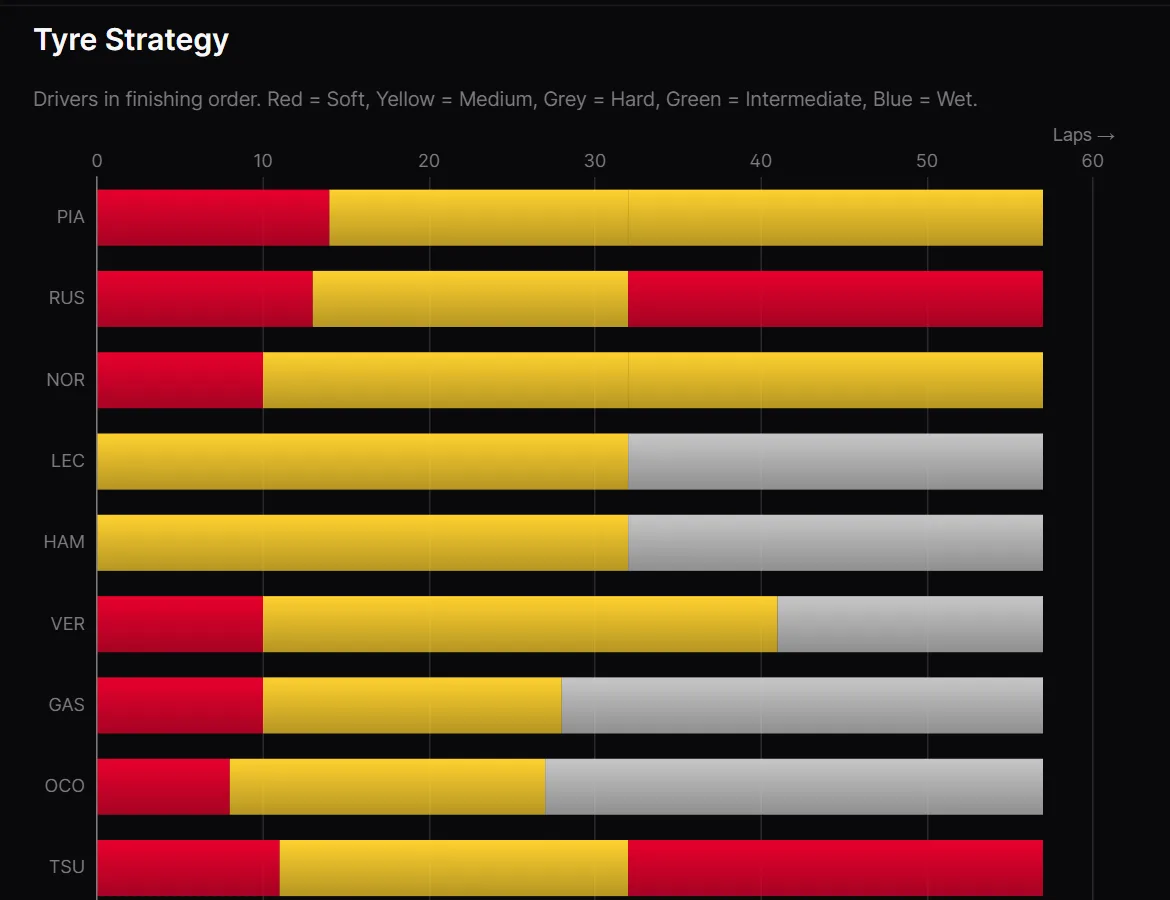
The dashboard is built with Evidence, a BI-as-code tool: every page is a Markdown file with SQL and chart components, version-controlled like any other code. It compiles to a static website. The data ships as compressed Parquet files, and visitors' browsers query it with DuckDB compiled to WebAssembly, so there's no server to run and hosting is free.
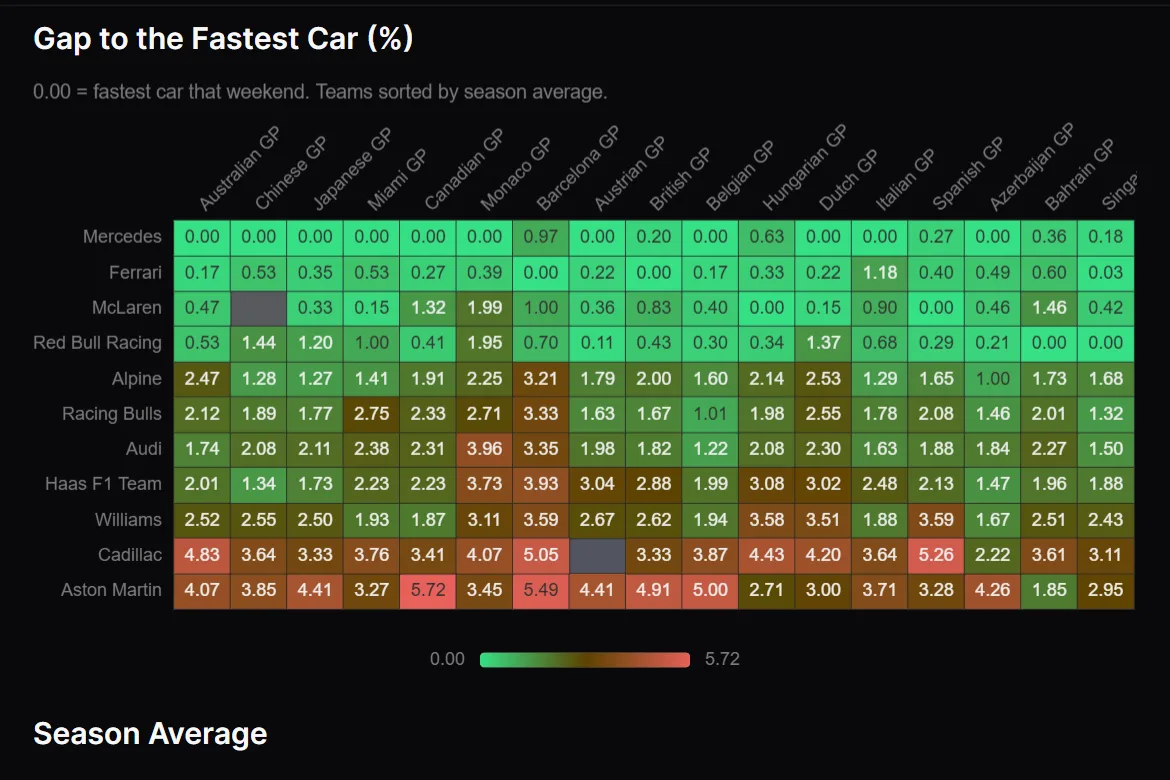
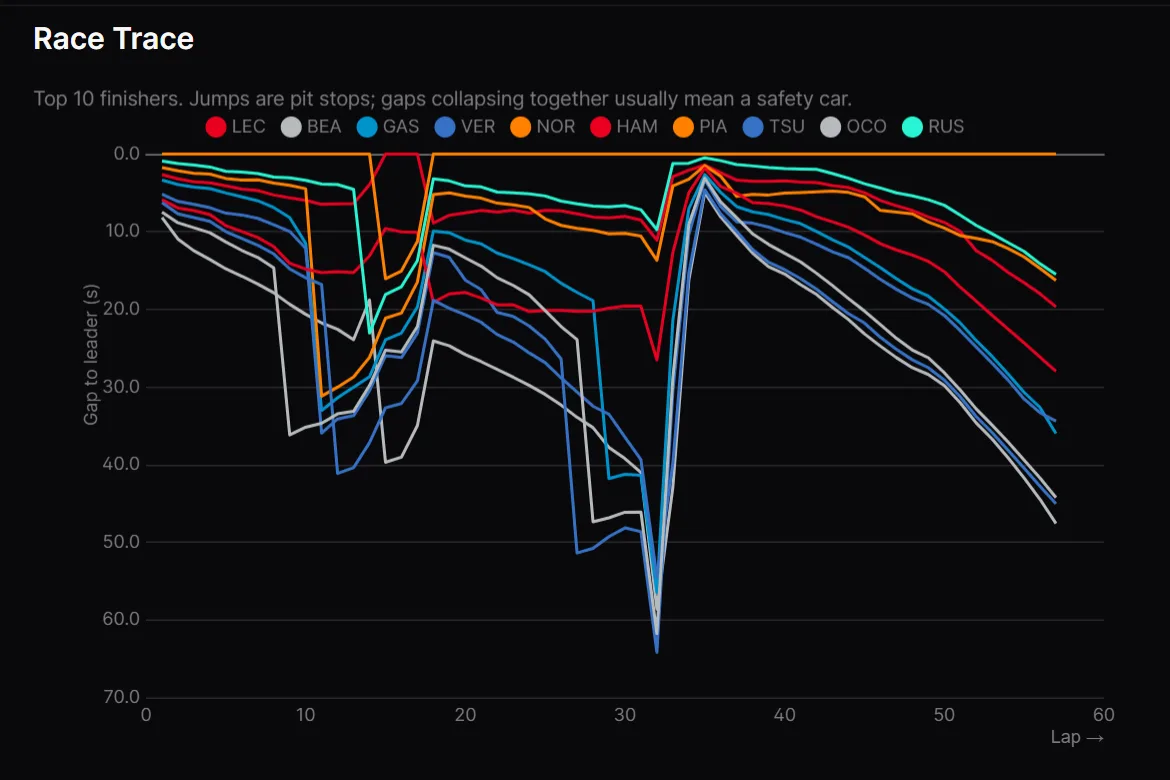
- 131 pages, including one page per Grand Prix and one per driver, generated from templates.
- Custom components where the built-in charts fell short, such as the sector bullet chart and gradient bar charts.
- A weekly automated refresh with GitHub Actions: new races are loaded, modelled, tested and published without me touching it.
What the data taught me
- Validate against reality, not just tests. Every test passed while my first "final standings" query was wrong: session keys don't increase through a season. Checking against the official table caught it.
- Absent isn't zero. Drivers who missed a race (injured, replaced) still appear in that race's standings, which broke a join until I added a season-level fallback.
- Know when not to show data. The API's overtake counts include position changes from pit stops, so I left them out rather than publish numbers I couldn't stand behind.
Tech stack
The source code is in a private repository. I'm happy to walk through it. Get in touch.